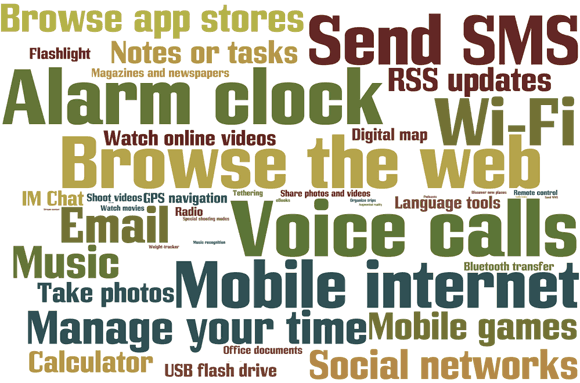
A few weeks back we asked some questions to find out how you, our readers, are using your mobile phones. Now we are back with the answers and they have some interesting stories to tell.
Did you ever wonder what kind of phone usage is normal? We seem to have a pretty good idea. Are cell phones still mostly used for making calls or has web browsing already taken over? The answer is right here.
In some places, more people use their phone as a wakeup alarm than they do to make calls. More
people use music recognition in North America than in any other place on Earth. You told us what features are used daily and what are only needed once in a while. We also know which are the most wanted but, for various reasons, still not widely used.
Before we go on though, we’d like to thank you for taking part in our survey so actively. More than 15,000 people responded, 10,000 of which clocked in the first 24 hours alone. As you could imagine, the results should be representative enough given the number of respondents representing various age groups, both genders and different continents.
And while the results can most probably apply to mobile phone enthusiasts all over the world they are hardly accurate as far as the whole world population is concerned. The thing is you, our faithful audience, are not exactly the average phone users. Being so informed and passionate about cell phones (why would you else be here reading all those long reviews) you tend to spend more time with your phone and use most of the features.
Here are some numbers that prove this further: 96% of all respondents browse the web on their mobile phone and more than 88% have a Wi-Fi enabled handset. You won’t be able to bring those numbers to the next class reunion, but you might just learn what your fellow commenters do on their handsets.
One final note before we begin: about 30% of the voters chose not to provide personal information but we still have plenty of feedback to be able to tell how the results vary across the different gender/age/location groups.
Now let’s check out those numbers, shall we? We will be starting with an infographic summing up some of our most exciting findings right after the break.
Most used daily
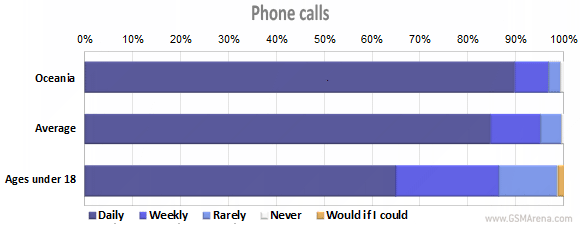
We start with the most important features, i.e. the ones that are used most frequently by most users. And the winner here… couldn’t have been more obvious… is voice calls.What came as a slight surprise however is the actual percentage – we expected results more in 95%+ range, so much so that we even considered leaving it out of the poll. Glad we didn’t, because we now see that not everyone use their phone as a phone. And in some user groups, the voice calls are even less popular – less than 65% of the teenagers talk daily on their phones.
In fact, voice calls only rank sixth in popularity in that group and it also loses its top spot among users aged 18 to 24 (though the feature retains a respectable 83% of daily usage there).
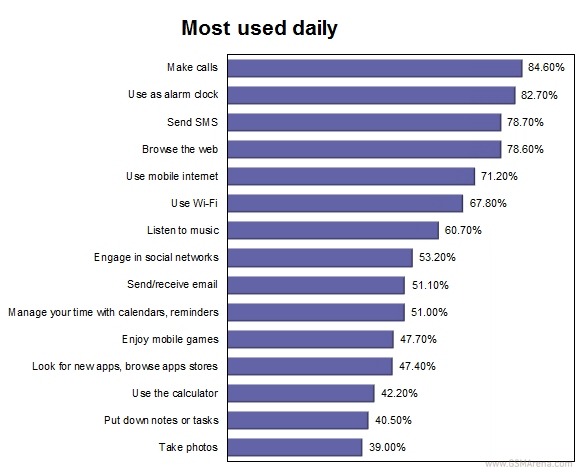
In terms of location, voice calls are most popular in Africa (89.5%) and least popular in Oceania (5th place at 77.6%).
The second most used feature worldwide was a bit of a surprise to us – with 83% it is alarm clock that snatches the silver. The feature even tops the chart for several user groups – women (81.3%), ages 18-24 years (83.5%) and South Americans (86.5%). It loses some ground with the users older than 41, but its popularity is consistently above 60%.
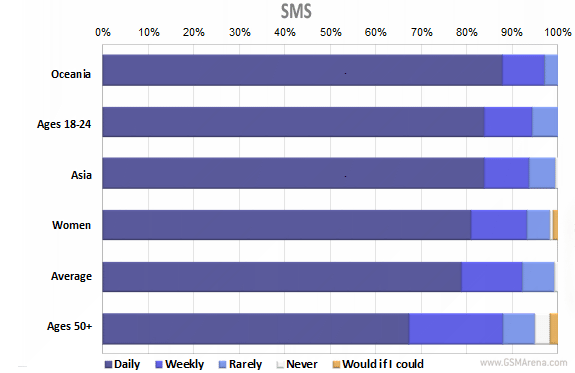
Sending texts might be in decline, but it still retains third position in daily usage. Its overall share is 78.7% and it even gets the number one place in Oceania with 87.7%.
SMS is also enjoying higher than average popularity with Asians (83.8%), where it’s just a tenth of a percent behind alarm clock usage. Surprisingly, only 75.8% of teenagers send SMS daily, which is less than average. Which is not to say that teenagers are no longer responsible for most of the SMS traffic. One possible answer here is that some teens are already switching to instant messaging – our data shows that one third of them are already using this feature daily.
Web browsing only loses a place on the podium by a whisker, which actually tells us how popular handheld browsing is (a mobile version of our site is in the works). 78.6% of the users open their mobile browsers daily. The champions in mobile web browsing category are Oceania (83.3%) and North America (80.9%) with browsing the second most used feature there.
This feature is less often used by women (70%) and users over 50 (63%).
Essential features
The chart we’re about to look at shows the features that are used by the largest number of people. Although not necessarily needed daily, they are the most likely must-haves for users shopping for their next handset.The obvious leader again is voice calls: 99.5% of you make calls at least ones every few weeks. In Oceania the feature which gave cell phones a reason to exist scores a perfect 100%, while the US gets pretty close with 99.9%.
In terms of overall use, SMS moves up to second place with 99.2%. And it’s another perfect score here from Oceania.
Taking photos is every bit as important as we expected – it grabs the third spot here with 98.5%. It means that less than one in 66 users never use the camera at the back of their cell phone. And half of those have answered that they would use that feature if they could, which suggests that their handsets don’t have a (decent) camera at all.
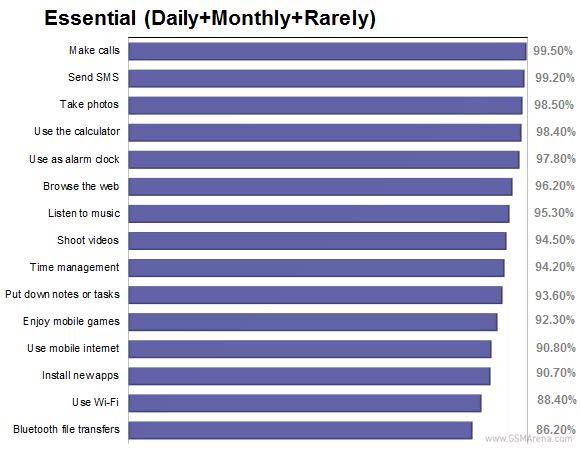
The two features that only just failed to make in to the medals are calculator (98.4%) and alarm clock (97.8%), while web browsing to sixth with the very respectable 96.2%.
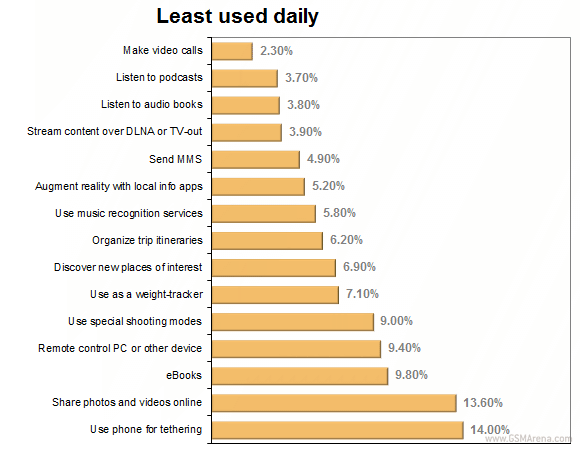
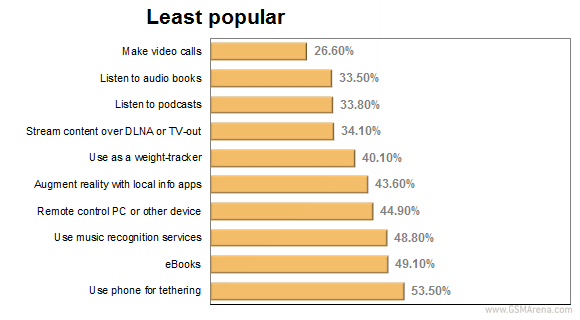
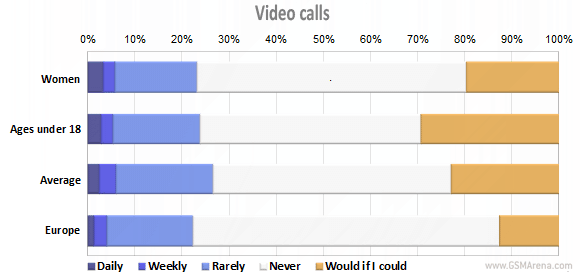
At the other end of the spectrum is video calling, which is only used by 26.6% of all users. Only 2.3% of you make video-calls on a daily basis.
Audio books (33.5% total and 3.8% daily) and podcasts (33.8% and 3.7% daily) are not too popular either but they are still head and neck above video-calls. Streaming content over DLNA or TV-out only just avoided relegation with 34.1% users doing it at all and only 3.9% needing it daily.
Not needed
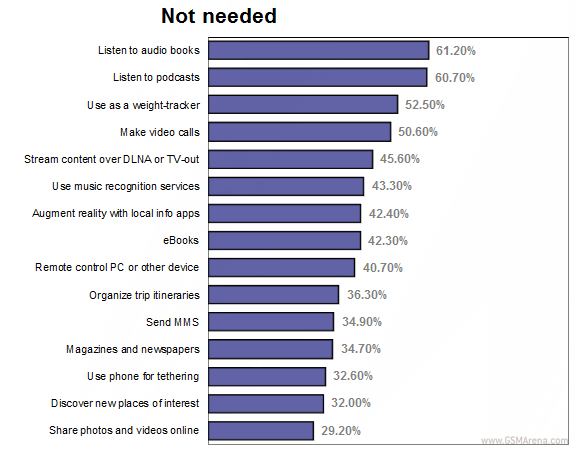
We now come to the features, which are the easiest to live without. Those are things people have on their phones but do not use, or lack but don’t want either.Audio books and podcasts scrape bottom here with more than 60% of mobile users not interested. Books are doing worse with 61.2%, while podcasts are considered useless by “just” 60.7% of you. Somewhat surprisingly these two features are doing notably better in the 50+ age group, where the percentages are brought down to 58.6% and 53.4% respectively.
Weight-tracking completes the anti-award top three but that was to be expected – it’s always been a niche feature. Users of age above 50 are least conscious about their weight (62.9%), while nearly half of teenagers (or 48.2% to be exact) either uses or wants to use some weight-tracking app on their cell phones.
Despite being the least used feature currently (and by some distance) video-calling only ranks fourth here with 50.6%. The difference here comes from the number of people who don’t use it, but would fancy trying it (more on them later). People aged over 32 are mostly indifferent to video-calling, while it is relatively more popular among those aged 25-32 – just 49.1% of them have dismissed it.
Most missed
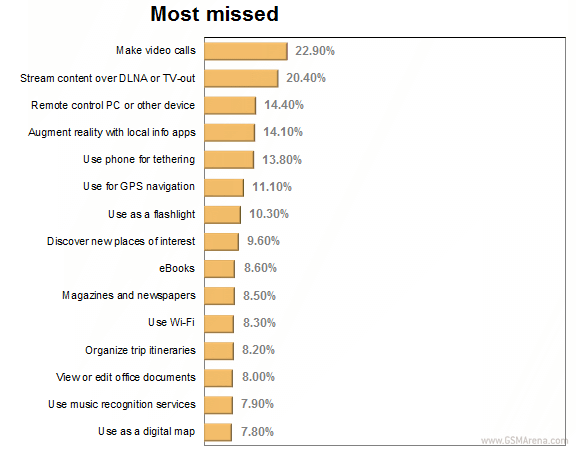
Next up is a list of features that people would like to have on their phone. It’s the features most of you have been missing for various reasons –.either the phone doesn’t support them, your carrier bills you out of them or they just haven’t been available yet.Shock and horror, it’s video-calling in the lead with 22.9%. People who have the feature enabled apparently have no interest in using it, while those who don’t have video-calls are pretty eager to try them. That’s why we feel that despite the high demand this feature might not substantially gain in popularity in the future – it has been tried and rejected once already.
We guess the prospects of the next two features in this list are better (Streaming over TV-out and remote controlling another device). Those have only recently started making their way to mass-market devices and cell phones have been becoming increasingly good at them.
FullHD video streaming has already began to appear on high-end devices, while even mid-range ones can do 720p now. And as mobile data speeds are improving remote-controlling your PC is becoming more and more of an enjoyable experience.
Now that we’ve covered the best and the worst we’d be looking at each feature on its own, trying to explain why it is used the way it is.
Phone calls
We’ve already covered voice calls extensively so there’s no need to go into further detail. Taking first place in four of the six age groups, four of the six continents and among male users, telephony is still the number one job of a mobile phone, disproving the theory that with the advance of smartphones talking on the phone would become a second fiddle.However, given that just under 65% of teenagers make calls daily, things are likely to change in the future. One in every eight users under the age of 18 only rarely talks on their phone and one in 70 have given up on the mobile phone’s main feature altogether. It’s still early to talk about data-only plans for smartphones, but there are signs that those might eventually come about.
At the other end of the spectrum, users in Africa mostly talk on their phones, which is easy to explain with the still high costs of mobile data there.
Video calls
From the most popular we move to the least used feature in modern day mobile phones. Just don’t be too quick to doubt Apple’s (and recently Google’s) efforts at promoting the feature.While every other user takes no interest in video-callingр there’s a huge audience that would gladly try it if given the chance. We can easily see that from marketing point of view, adding video calls to a phone makes a lot of sense. We’d have to wait and see if those 22.6% (and impressive 29.3% in the pre-18 age group) will stick to using video-calls when they can or they will just turn their back on it like the rest of us.
Across the different surveyed groups, there isn’t a big difference in regards to video-calls. Europe is where the feature is used the least. Only 1.3% of Europeans use it on a daily basis, while almost 65% never do and have no interest in using it. Interestingly, women make the most video-calls, but they only reach 3.1% in the daily column and another 2.7% on a weekly basis.
Short message service (SMS)
We take another trip across the popularity table and we are back near the top of the charts with SMS. The third most popular application of cell phones globally is doing really well among women – 81% of all female users text daily, while another 17.3% also confess doing it, only less regularly. Ok, that last part may come out wrong if you strip it of context.Texting is most popular with users in Oceania (all of the surveyed use the feature and a good 87.7% of them do so daily). In fact, it takes the number one spot there beating voice calls by over 10% in the daily usage column. Asians and users aged 18-24 are the other two groups that text more than average.
The only ones that are not as keen on SMS are, expectedly, users of over 50 years of age.
Multimedia message service (MMS)
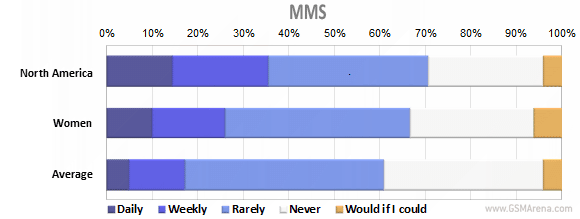
This next feature is not so much of a has-been as a never-were. Multimedia messages never reached the popularity that carriers probably hoped for and are now among the least used things on a mobile phone.Despite being so widely available, MMS is used by just 4.9% of all people daily and we have to admit that even that number sounds too high to us.
It’s mostly North Americans that send these messages – one in seven users does so every day and more than one in five each week. Female users are also using MMS fairly regularly, exceeding the average usage more than twice.
MMS is not going to be extinct any time soon though – at least half of respondents admit they use them occasionally.
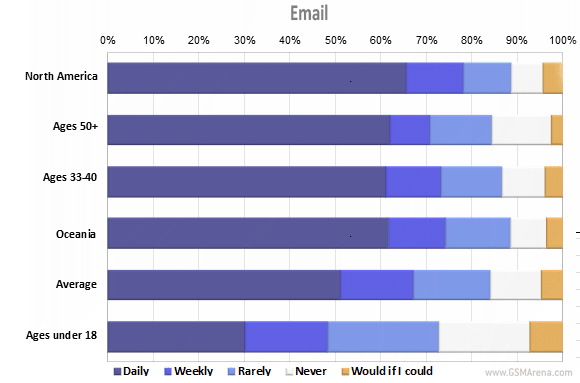
Surprisingly, teenagers send or receive email the least (just 30% daily users and 72.9% of total users). However with those of you over 24 years the daily percentage rises above 60. Understandable, given the importance of email in most jobs nowadays.
We can’t help but be impressed by the number of email users in Oceania and North America .
| source |


0 comments:
Post a Comment